Knowledge HubTM
Debugging Latency on 40 SurfProtect servers
- Date Posted:
- Read time: 11 min read
- Written by: Exa Networks
For the past couple of weeks, our active monitoring detected several occasions where the latency of traffic going through our SurfProtect service increased significantly enough to be worthy of investigation.
At the outset of the investigation, when our monitoring tools first identified the problem, the effect on our customers was not pronounced enough to be noticeable. But our team discovered that the issue was persistent and that the problem never seemed to be accompanied or preceded by any change in traffic patterns or other services that might explain them.
Unfortunately, the problem became service-affecting before we were able to resolve it. This article explains what happened, why and how we were able to restore services to their normal service level.
Investigating the reason for the slowdown
Investigating our code
SurfProtect is a complex application provided by over 40 servers, 16 of which are proxies taking customers’ HTTP and HTTPS requests, accepting or blocking them.
Our service monitoring includes exporting information about the response time of different components. Looking at this data, we could see that we were making filtering decisions promptly and that the cause of the latency was within our proxy code, which was surprising as this code had been stable and well-behaved for a few years.
Our proxies are written in Go, a language designed by Google to develop high-concurrency applications such as our proxy. This language comes with excellent real-time debugging tools, which we have come to master.
The team used them to seek to understand the reason for the slowdown. Unfortunately, following our initial research, we could only establish that the SurfProtect proxy process was taking longer and longer as time went on, waiting for the OS to respond to network reads and writes.

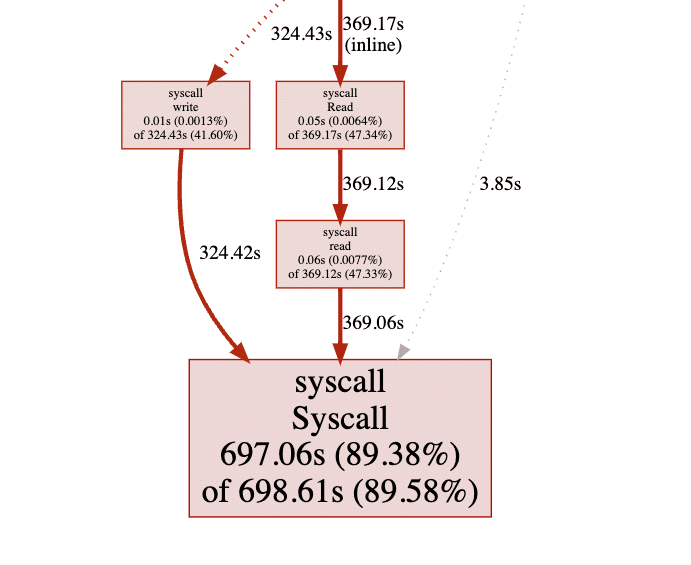
The image on the left is an excerpt from a visualisation we use to understand where the application spends most of its time.
This particular data comes from one of the incidents where latency on a machine rose by about 100ms. Average samples were showing CPU usage of around 40% performing the same tasks, compared to our expectation of 25% during standard operation.
89.58% of our available CPU resources were spent waiting for the OS to respond to read and write operations to the network.
This meant that the remaining 75% of the work usually performed by the proxy, was being performed with the remaining 10.42% of resources available on the machine.
Our team started to look into what could have caused this behaviour change.
Investigating CPU usage

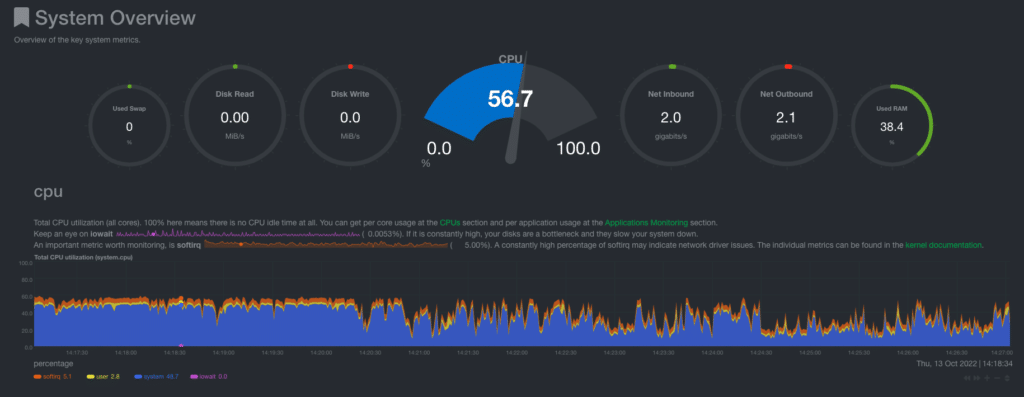
Looking at the CPU usage graph illustrates the issue. The CPU time allocated to the proxy service (in yellow) became negligible compared to the time spent within the Operating System (in blue). We also expect this class of machine to show far lower CPU usage at such relatively low bandwidth usage.
As the proxy processes are allowed to use (up to) all of the cores on one of the two processors present, it’s clear from the flat line at 60% overall usage that we had hit a resource contention which led to the latency issue we experienced.
The search for the root cause
Our team then realised that we needed to change our perspective and identified two independent courses of action to push us towards a resolution.
Right from the start of the incident, our tools functioned as we hoped, alerting us to high latency and abnormal resource usage, recording when they occurred, and highlighting the reason for the latency with the proxy’s code. Still, we had no visibility of what was happening inside the kernel. We could not explain why we were experiencing high CPU usage.
By and large, our monitoring focuses on the service we provide and allows us to inspect the behaviour of our software. We’re usually happy to rely on the Linux kernel to do its job after we’ve been through the process of validating during testing and through progressive acceptance in service that it can support the features we use.
Based on our deployment experience, we have a good idea of how a machine will respond to certain types of workload and the states of its various subsystems. We have a broad understanding of how Linux subsystems are implemented, but in this occurrence we were initially frustrated. None of the information generated seemed to suggest a reason for the issues. Nothing had changed since the end of the previous school year, which had seen much higher traffic volume per service. We deployed more machines during the summer, so the traffic and CPU load per machine should be lower, not higher. Nothing related to networking on the servers also looked out of place.
Facilitating the gathering of data
We needed to extend our monitoring to the Linux kernel during outages. We realised our team already had a documented way to gather this data during investigations, but we were missing a quick and easy mechanism to standardise the data collected. We decided to put together new tools to gather the information we thought would help our engineers.
But we had to be careful: some of the mechanisms required to gather this information were already running at high CPU levels, and our actions could impact normal operations. We could not leave this running permanently but had to wait for an incident to collect the data.
Investigating Linux
As the problem was not within our code, our first course of action was to ensure that we were not potentially affected by recently released and misbehaving drivers or firmware.
We then debated between rolling back an older version or updating it to a new version of the kernel just released a few days earlier. We decided to update first instead of downgrading: even if downgrading could resolve the issue, it would prevent us from diagnosing the problem. We were unsure we could replicate the issue in our test environment, and holding back the machines’ kernel version was not a long-term solution. However, it happened that we found the reason for this behaviour before we could roll back.
We also saw to determine if we could correlate at least the most severe incidents to any particular hardware vendor. During our investigation, it became clear that our newly encountered OS problems were happening across the different generations of machine and networking cards. Upon investigation, we could not trace the faulty behaviour to any specific software, firmware or hardware combination.
Diving deeper
While our investigations and new tool development took place, we also had to investigate the possibility of a non-hardware-related issue with the Linux kernel.
As pointed out above, right at the start of the investigation, we identified an issue with Linux system calls while reading and writing to the network. We decided that we needed to understand what exactly Linux was doing while handling our IO requests. If we could see pauses while writing to or reading from network cards, it would confirm a possible driver issue; otherwise, it should give us food for thought and allow us to move forward.
So the team turned to the ‘perf’ tool to investigate why system calls took so long to return.
Due to initial unfamiliarity with the ‘perf’ tool, we went straight to the interface provided by debugfs and used by ‘perf’ for this purpose. Once understood, acquiring the data we wanted could not have been simpler:
					echo "function_graph" >  /sys/kernel/debug/tracing/current_tracer
echo 1 >  /sys/kernel/debug/tracing/tracing_on
cat /sys/kernel/debug/tracing/trace > trace
While our worries eventually proved unwarranted, the data initially made us wonder if we were monitoring contention within the tracer code. So, we limited the monitoring to only one core to limit the likelihood of going down a false track:
echo "00000000,00000000,01000000" > /sys/kernel/debug/tracing/tracing_cpumask
This command provided us with a very detailed trace of precisely what was going on, along with high-resolution timing information showing how long everything was taking. It was perfect, or almost perfect, since enabling the tracer saw CPU usage jump, and we could not accurately collect data from a machine exhibiting the problem. Still, the data gathered was enough to identify a specific issue conclusively.
Our analysis focused on the kernel function do_syscall_64, used by the IO calls. The data indicated that most calls returned within a perfectly reasonable time but that some calls inexplicably took 10s to 100s of milliseconds, matching what we’d already observed with the output of ‘perf’.
Further analysis showed an interesting pattern that occurred in ‘slow’ calls:
					kprobe_ftrace_handler() {
 93)   0.140 us    |          get_kprobe();
 93)               |          pre_handler_kretprobe() {
 93)   0.150 us    |            _raw_spin_lock_irqsave();
 93)   0.150 us    |            _raw_spin_unlock_irqrestore();
 93)   0.150 us    |            arch_prepare_kretprobe();
 93)               |            _raw_spin_lock_irqsave() {
 93) # 1459.327 us |              native_queued_spin_lock_slowpath();
 93) # 1460.008 us |            }
 93)               |            _raw_spin_unlock_irqrestore() {```
and
					 79)               |        trampoline_handler() {
 79)   0.140 us    |          kprobe_busy_begin();
 79)               |          kretprobe_hash_lock() {
 79)   0.150 us    |            _raw_spin_lock_irqsave();
 79)   0.411 us    |          }
 79)   0.140 us    |          percpu_array_map_lookup_elem();
 79)   0.140 us    |          percpu_array_map_lookup_elem();
 79)   0.140 us    |          bpf_get_current_pid_tgid();
 79)               |          __htab_map_lookup_elem() {
 79)   0.150 us    |            lookup_nulls_elem_raw();
 79)   0.652 us    |          }
 79)               |          htab_map_update_elem() {
 79)               |            _raw_spin_lock_irqsave() {
 79) # 1433.058 us |              native_queued_spin_lock_slowpath();
 79) # 1434.020 us |            }
This information allowed us to establish where the CPU spent its time. Rather than just checking in periodically with the network hardware, the kernel attempted to acquire a lock rather than doing valuable work.
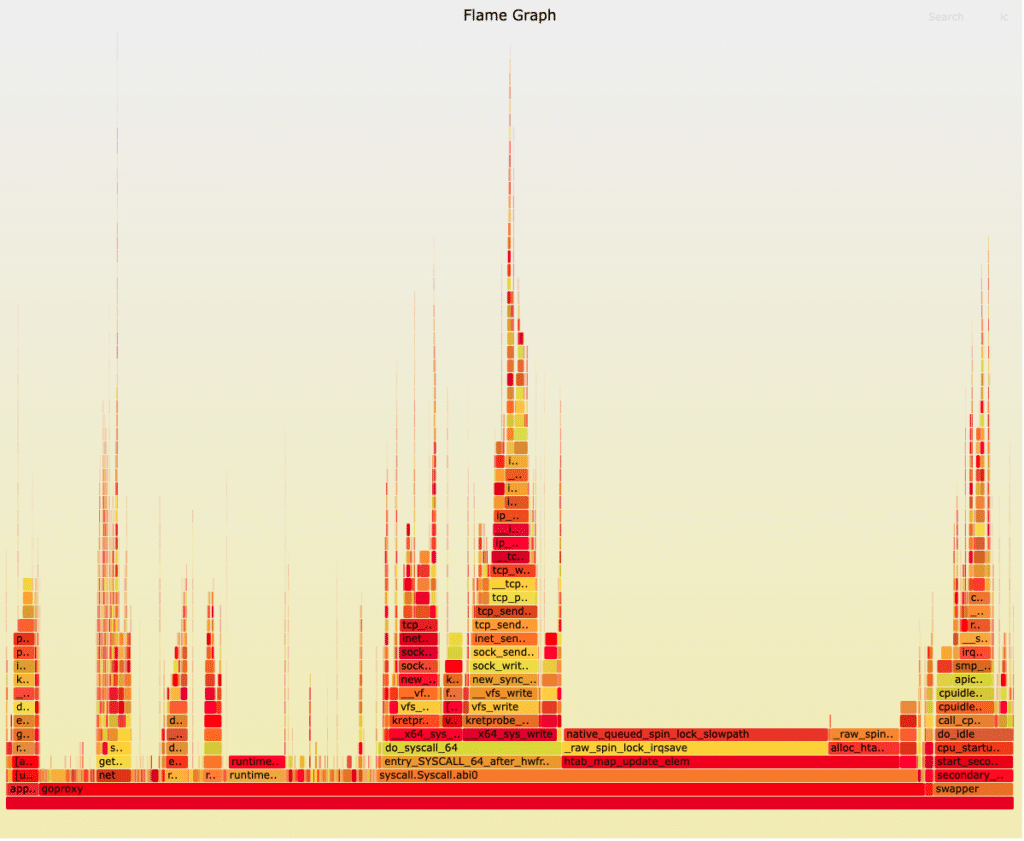
We were now looking in the right place, but most calls to do_syscall_64 were reasonably fast, so we used the data to generate a flame graph to better understand the scale of the problem. It provided rather convincing evidence to support our belief that there was an issue with our newer kernel:

The server was performing minimum work; the CPU core was busy acquiring a spinlock for about 1/3 of the available time. As we had established that the proportion of ‘wasted’ time grew as the problem worsened, we could now explain this behaviour as increased contention as threads become more likely to vie for the shared resource.
We now knew that we were putting effort into the right place and went back to the analysis of the kernel trace. We were relieved when we tied the problem behaviour ultimately to calls to security_socket_sendmsg, which in turn calls apparmor_socket_sendmsg.
Resolution
Finding the change
AppArmor is a Mandatory Access Control (MAC) system that provides fine-grained access rights to resources within the kernel. Like sandboxing, it can limit what an application can and can not do on the server.
This Linux feature is handy when running untrusted programs and is used on our customer web servers. However, it does not achieve much on our proxies that only run our proprietary software, where we are in a position to use coarser mechanisms to provide privilege separation and security. It left us with the straightforward option of removing AppArmor from the affected machines as it consists of kernel features which are enabled from some userland programs.
The removal was first performed on one server at approx 12:50 on Thursday, 14th October. We removed the Linux AppArmor package from the machine and rebooted the server. We then migrated some customer traffic to the machine and noted no sign of increased latency. Another maintenance was therefore scheduled for the evening to roll this change out across all servers in the cluster.
While we have not yet conclusively linked the periods of severe latency to the persistent issues that were the focus of our investigation, CPU usage has remained stable since this maintenance, and we have detected no further anomalous latency. The below CPU-usage graph shows that the previously struggling server is now able to handle the same level of traffic with much-reduced CPU usage:

(NB: the periodic spikes in CPU usage are expected behaviour caused by memory garbage collection within our proxy process and do not contribute to latency.)
We also see in our flame graph that there’s no longer any sign of the CPU wasting cycles in a spin lock:

Detection
The instant we confirmed that disabling AppArmor appeared to fix the issue, team members were on hand to tell us that the package provided the affected code had last been updated by our Linux vendor as part of their security updates on the 31st of August 2022.
It was initially confusing since there was no sign of the issue for weeks when the school year started. As the behaviour changes on servers after a reboot, and since the contention seems to only occur once the level of traffic saturates the CPU, it wasn’t clear from our monitoring that affected machines had recently been rebooted. We only reboot the machine to apply kernel when the update fixes security issues and not generic problems, as our proxies have to run for long periods with no downtime.
Looking Forward
We have monitoring in place to track the running version of our own software, but this doesn’t yet extend to tracking the running kernel version or the versions of any modules that may impact us.
We will update our operating procedure to track our active cluster members’ kernel version and machine uptime. From now on, we should be able to identify better when changes have delayed consequences more easily.
And following this work, our new tool will continue to evolve and help us gather more data from our cluster of SurfProtect servers.
Related Knowledge Hub™ Articles
- 24 March 2025
- 24 March 2025
- 2 min read
- 26 April 2024
- 15 May 2024
- 2 min read


